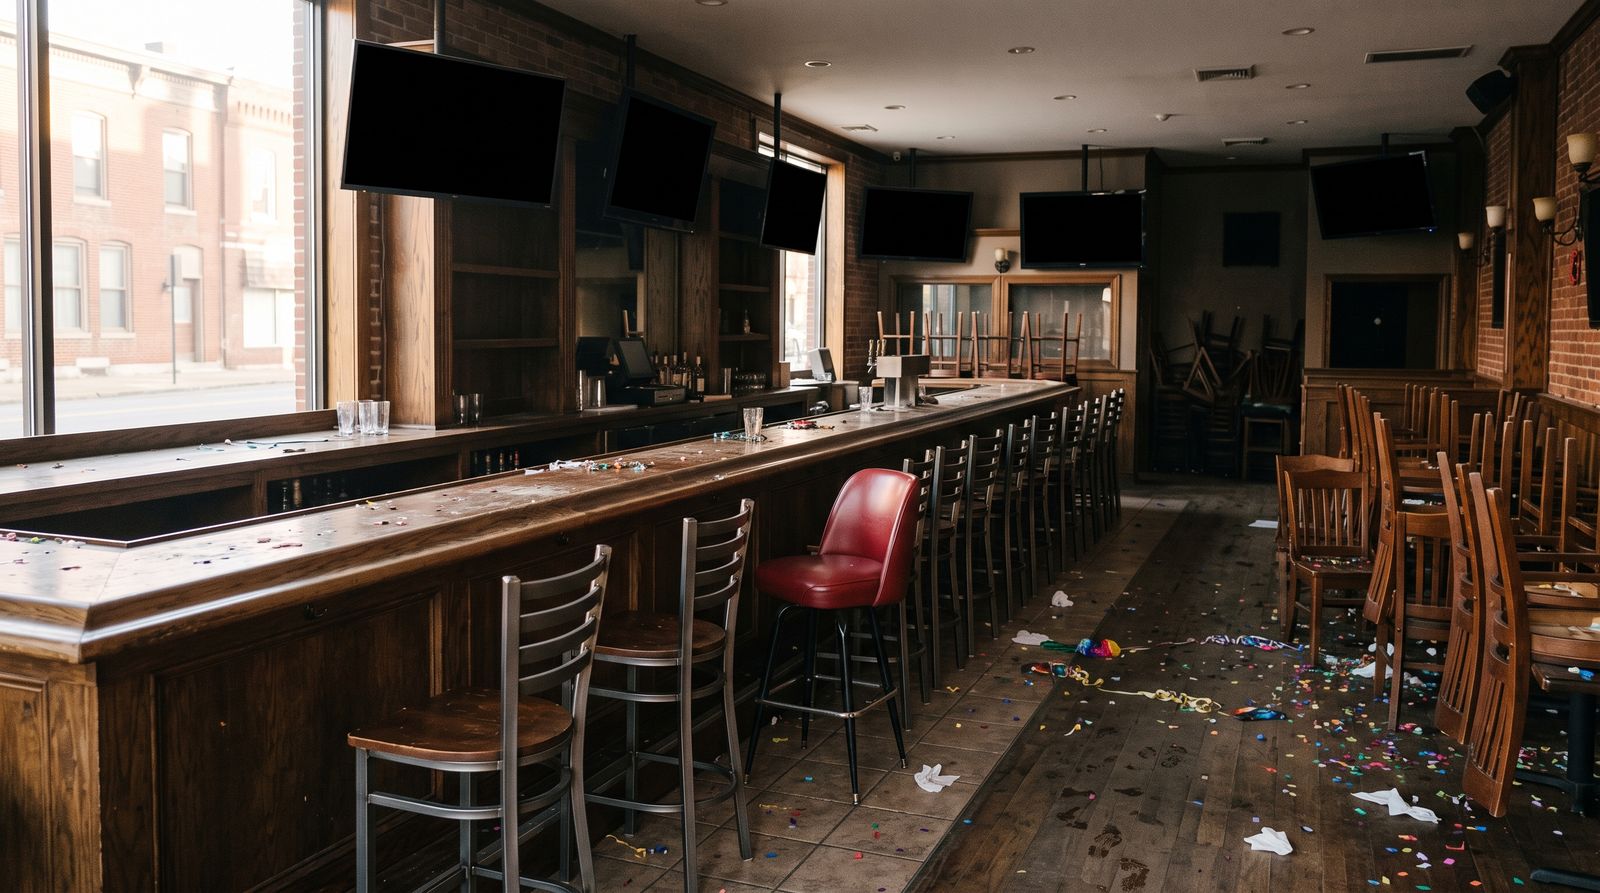
Bank of America’s July Consumer Checkpoint reports credit and debit card spending up 6.3% year over year — the strongest growth the bank has measured in four years. Chief executive Brian Moynihan told CBS’s Face the Nation that around half of the World Cup’s roughly $40 billion in economic activity landed in the United States, about $20 billion. “Spending is going into what we call bricks-and-mortars,” he said, “going to bars and restaurants and things like that — not necessarily only the people in the stadium.”
The bank’s researchers measured two windows: May 20 to June 9, before the tournament began, and June 10 to June 30, after. In host cities, restaurant spending doubled between them, from roughly 3% growth to 6%. Non-host cities were essentially flat. That is about as clean a natural experiment as consumer data ever gives you, and it points one direction: the acceleration was the tournament.
Which is the problem with the headline number. The tournament ended on July 19.
Not everyone got the boom
The gains were also narrower than “$20 billion” suggests. Eleven US cities hosted matches, and the winners were the ones nobody had on the list. Hotel revenue in Philadelphia ran more than 50% above the same period last year on match days, according to CoStar, and Arlington, Texas booked record hotel revenue of $31 million for the month.
The obvious destinations underperformed. The Hotel Association of New York City expected the tournament to add about $100 million to citywide hotel revenue against a $300 million forecast — a third of the projection. “Overall a disappointment,” its chief executive Vijay Dandapani said. “There’s no other word that I can say.” Los Angeles hoteliers watched bookings run below normal until a late surge rescued the month. On the day of the opening match, Reuters reported that the travel and tourism lift simply had not shown up: flight bookings were down and ticket prices were keeping fans home.
Zoom out further and the scale looks different again. FIFA’s own pre-tournament analysis projected $80.1 billion in gross economic impact across the three host nations, with $30.5 billion of it in the US. Bank of America’s read of actual card data puts the tournament nearer $40 billion total and roughly $20 billion domestically. The two use different methods and aren’t strictly comparable — but the gap between forecast and measurement is roughly the size of the forecast.
Our take: This is a strong number with an expiry date printed on it, and it lands four days before a Fed decision that futures already price at about 82% for a hike by September. A committee looking for evidence the consumer can absorb tighter policy just got a 6.3% print. A committee reading carefully got a 6.3% print built on a five-week sporting event in eleven cities, concentrated in bars, restaurants and hotels, that will not repeat in August. Both readings are defensible, which is exactly why this data doesn’t settle anything. For operators the lesson is narrower and more useful: if your Q2 was good, find out how much of it was event-driven before you build a Q3 plan on it. The Philadelphia bar owner who grossed $13,000 off a single screening knows the difference between demand and an occasion. Most quarterly decks don’t.
What to watch
- The August Consumer Checkpoint. First clean month with no tournament, no holiday distortion. That is the read on whether the underlying consumer actually accelerated or just showed up for the soccer.
- Wednesday’s Fed language. Whether the statement treats recent consumer strength as durable or as seasonal tells you how much weight the committee puts on one very unusual June.
- Host-city hotel data in the fall. Kansas City and Arlington posted records. The question is whether the exposure they built — staff, inventory, rates — survives a normal autumn.
- Card-spending mix. Restaurants and bars carried this. If discretionary services roll over in August while essentials hold, the June number was an event, not a trend.