There is a specific way businesses get hurt by cost inflation, and it is almost never the way they prepared for.
They hedge the input they can name. A bakery hedges flour. A logistics firm hedges fuel. A manufacturer locks steel. Then the damage arrives through a line nobody thought of as a commodity exposure at all — a freight contract that indexes to diesel rather than crude, a cloud bill that reprices on a region's power costs, an insurance renewal that moves with reinsurance capital, a contractor rate card that tracks a labour index in a country you have never visited.
The pattern is consistent: the exposure you named is the one you managed, and the exposure that hurt you was one line below it on the P&L.
This playbook is a fix for that. It is a two-hour audit — genuinely two hours, once, with your P&L and your contracts open — that maps every cost line to what actually drives it, ranks the exposures by how much damage they can do, and assigns one of four responses to each. Run it once a year and after any large supply shock. It is not sophisticated. It is just rarely done.
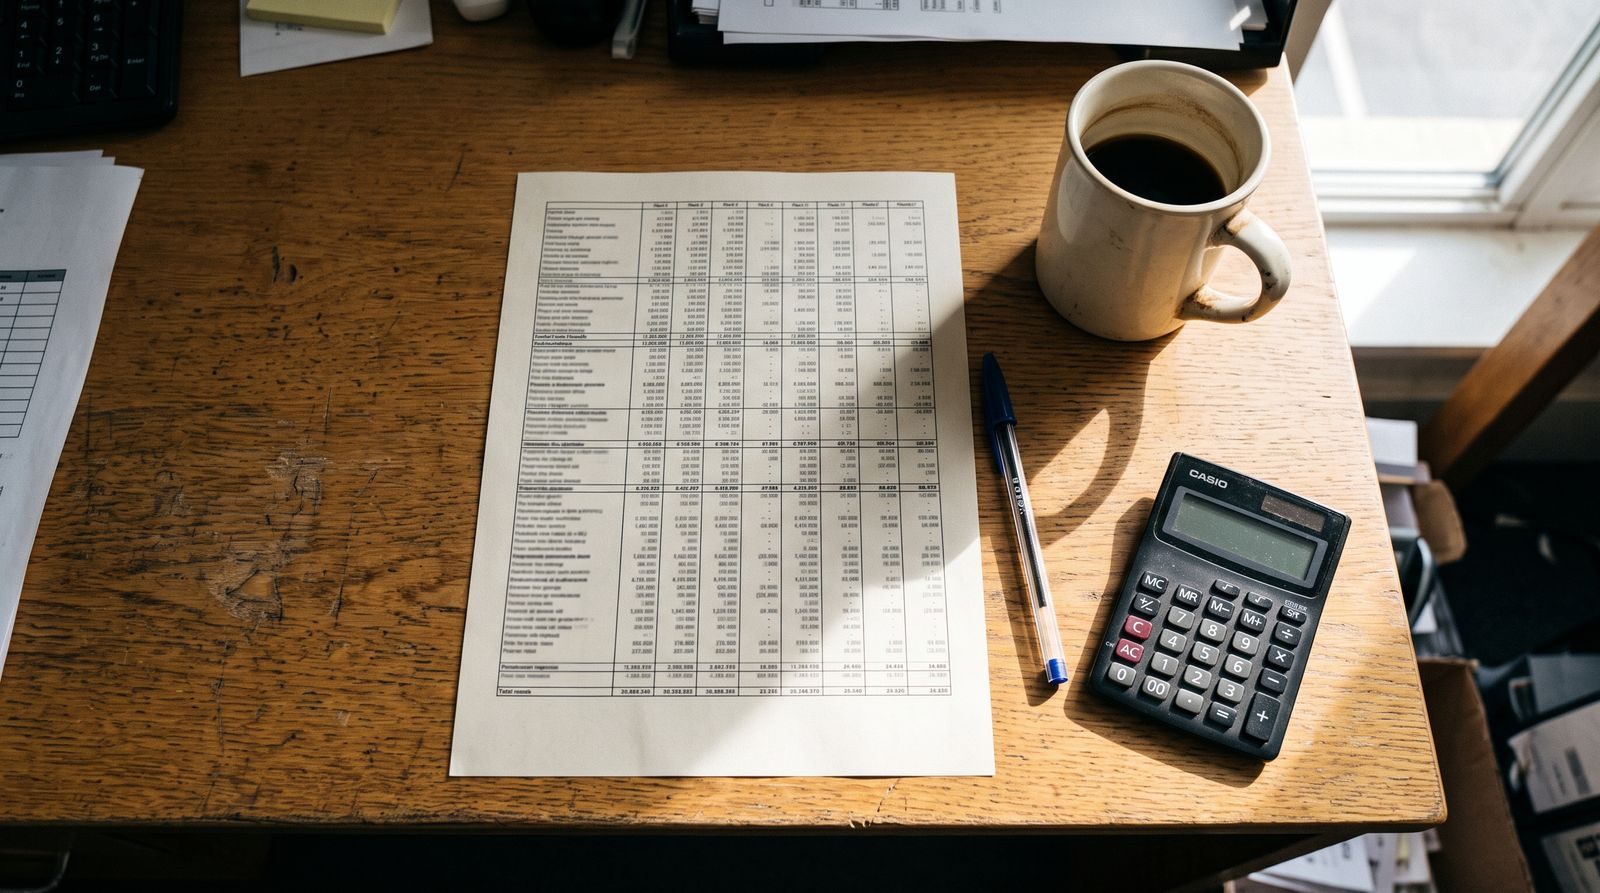
Step 1 — Pull the twelve-line P&L (20 minutes)
Open your last full year of costs and collapse them to no more than twelve lines. Twelve is the constraint that makes this work: it forces you to aggregate small stuff and stops the audit becoming an accounting exercise.
For most businesses the twelve are some version of: payroll, contractors, rent or facilities, utilities and power, freight and logistics, raw materials or COGS, software and cloud, payment processing, insurance, professional services, marketing and media, and debt service.
Write each line with its annual dollar value and its percentage of total cost. Order by dollars, largest first. You are done with step one.
Step 2 — Name the driver behind each line (40 minutes)
This is the whole playbook. For each of the twelve lines, answer one question:
If this line went up 30% next year, what would have caused it?
Not "inflation." Not "the market." A specific, nameable driver — the thing that has to move for your line to move. Then answer three follow-ups per line:
- Is the driver in my contract, or behind it? A freight rate that explicitly indexes to a diesel benchmark is in your contract — you can read it. A supplier's own fuel cost, which will reach you as a renegotiation in nine months, is behind it. Both are exposures. Only one is visible.
- How long is my insulation? The number of months before the driver's move can reach your P&L. A three-year fixed lease is 36 months of insulation. A monthly cloud bill is zero.
- Can I pass it through, and how fast? Score 0–2. Two means you have contractual escalators or you reprice at will. One means you can raise prices but it takes a negotiation and a quarter. Zero means you are eating it.
Worked example — a 40-person specialty food producer.
- Raw materials, $4.1m, 34%. Driver: three agricultural commodities plus packaging resin. Contract: two of three indexed explicitly. Insulation: 6 months on forward purchases. Pass-through: 1.
- Payroll, $3.6m, 30%. Driver: regional wage market, not a commodity. Insulation: 12 months to annual review. Pass-through: 1.
- Freight, $1.4m, 12%. Driver: diesel, not crude — the carrier contract carries a fuel surcharge indexed to a retail diesel benchmark. Insulation: 0 months, it floats weekly. Pass-through: 0.
- Facilities and power, $900k, 7%. Driver: regional wholesale electricity plus a fixed lease. Insulation: 22 months on lease, 0 on power. Pass-through: 0.
- Insurance, $310k, 3%. Driver: property reinsurance cycle. Insulation: 8 months to renewal. Pass-through: 0.
That producer had a commodity hedging programme. It covered raw materials. The line with zero insulation and zero pass-through was freight — 12% of cost, floating weekly, on a surcharge nobody had read the formula for. In a year when retail diesel rises 60%, a 12% cost line with a full pass-through surcharge does more damage than a 34% line that is half-hedged.
Step 3 — Score and rank (15 minutes)
For each line compute a crude exposure score:
Exposure = (% of total cost) × (12 − months of insulation) ÷ 12 × (2 − pass-through score)
Cap insulation at 12 months. The formula is not clever and does not need to be — its only job is to rank. A line that is large, floats immediately, and cannot be passed on scores high. A line that is large but locked for two years and fully passable scores near zero.
Rank the twelve. In almost every audit we have seen run, the top three include at least one line the business had never thought of as an exposure. That line is the entire return on this exercise.
Step 4 — Assign one of four moves per line (30 minutes)
Every ranked line gets exactly one of these. Not a plan — a move, with an owner and a date.
- Fix it. Convert a floating price to a fixed one. Renegotiate the surcharge formula, sign a longer term, lock a forward. You pay for this in rate — a fixed price is almost always above the current floating price, and that premium is the cost of certainty. Fine. Buy it on your top-ranked line only.
- Index it forward. If you cannot stop your cost floating, make your revenue float the same way. Add an escalator to your customer contracts referencing the same benchmark your cost references. This is the single most under-used move on this list, and it is much easier to negotiate at contract signing than at renewal.
- Substitute the driver. Change what the cost depends on. Move a workload to a region with different power pricing. Qualify a second supplier on a different input. Shift a freight lane from road to rail. Slow, structural, and the only move that permanently reduces exposure rather than transferring it.
- Accept and reserve. Decide explicitly that you will eat this one, size the worst case, and put the number in your plan. This is a legitimate answer. It is only a failure when it happens by default instead of by decision.
The three scripts
To a supplier, on a surcharge formula you have never read:
"I'm doing an annual cost-driver review and I want to make sure I understand our surcharge properly. Can you send me the exact index it references, the lag between the index print and our invoice, and the last twelve months of the surcharge as a separate line? I'm not asking for a discount — I'm trying to forecast."
Suppliers answer this readily because it is not a price fight. You will frequently discover the index is not the one you assumed.
To a customer, adding an escalator at renewal:
"I'd like to change how we handle input costs rather than come back to you with an ad-hoc increase mid-term. I'm proposing we hold the base rate flat and add a pass-through line tied to [named public index], capped at [X]% a year, adjusted quarterly, and it moves down as well as up. You get a predictable formula instead of a surprise conversation."
The cap and the symmetry are what make this signable. An uncapped, one-way escalator reads as a blank cheque and gets rejected.
To your own team, on ownership:
"Every line on this list has one named owner. Your job is not to control the price — you can't. Your job is to see the move thirty days before it hits us and tell me. If a driver on your line moves more than 10% in a month, that is an email to me the week it happens."
The four ways this goes wrong
- Hedging the famous input instead of the exposed one. Crude is liquid, quotable and easy to hedge. Refined product margins are neither. Businesses hedge crude, feel protected, and then take the full move in diesel because the constraint was refining capacity, not barrels. Always hedge the thing you actually buy, not the thing upstream of it that shares a name.
- Confusing a fixed contract with a fixed cost. A supplier on a fixed price who is losing money on you will renegotiate, invoke a force majeure clause, or fail. Your insulation is the shorter of the contract term and the supplier's ability to survive it. Check their margin before you count the months.
- Passing through cost and calling it pricing. A pass-through preserves your margin percentage. It does not preserve your customer. If your competitor absorbs the same shock and you do not, you have handed them a share gain funded by your discipline. Pass-through is a margin tool, not a strategy — decide it alongside your competitive position, not in isolation from it.
- Running the audit once and filing it. The audit's value is the ranking, and the ranking moves. A line with 22 months of insulation is a non-issue this year and your top exposure the year after. Re-run it annually, and immediately after any shock big enough to make the news.
The one-page output
When you are done you should have a single table with twelve rows and six columns: line, dollars, % of cost, driver, months of insulation, exposure score, move, owner, date. That page is the deliverable. It goes in the board pack, it goes to your CFO, and it is the thing you reread the morning a commodity you had not been watching sets a record.
Our take: The reason this audit finds things is that P&L lines are organised by what you bought and risk is organised by what moves. Those two structures do not overlap, so anything that spans several lines — power, fuel, a single labour market, one benchmark rate — is invisible on the statement you actually look at. Two hours of mapping one to the other is the highest-return finance work available to most operators, and almost nobody does it until after the shock. Do it before.
What to do this week
- Monday: pull the twelve-line P&L. Do not start the audit — just get the twelve lines and the dollars.
- Tuesday: the 30% question on all twelve. This is the two hours.
- Wednesday: send the supplier script to the owners of your top three lines. You are asking for index names and lags, nothing else.
- Thursday: score, rank, and assign one move per line in the top five.
- Friday: put the one-page table where your finance lead and your board can see it, with a re-run date twelve months out.
The businesses that come through cost shocks intact are not the ones with better hedges. They are the ones that knew which line was going to move first.